Market Conditions in Louisville, CO [Analyze This]
by Osman Parvez
It’s time for an update on real estate market conditions in Louisville, CO. The following analysis is based on data through the end of February, 2014.
To receive my regular research report, subscribe to House Einstein research. Click HERE.
INVENTORY
As with other parts of Boulder County, the big story remains the inventory shortage. Only 20 houses were on the market in Louisville last month, down 47% from the same period a year ago.
SALES VOLUME
10 homes sold during the month of February, 11% more than last year.
In a small market like Louisville, month to month activity can be quite volatile. It’s important to look at longer periods of time to get a sense of the real trend.
90 homes sold during the past six months (ending in February), a 5% increase from the same period a year ago.
Over the last twelve months, 238 homes sold. Up 1% from a year earlier. Note that sales volume remains well below the peak of 2006.
DAYS TO OFFER
The average days to offer fell to 34, the lowest February reading since I’ve been tracking. Keep in mind that desirable properties have been going under contract almost immediately. It’s important to see houses as soon as they’e listed for sale.
MEDIAN PRICE
 |
The median sale price during February was $487,500.
ABSORPTION
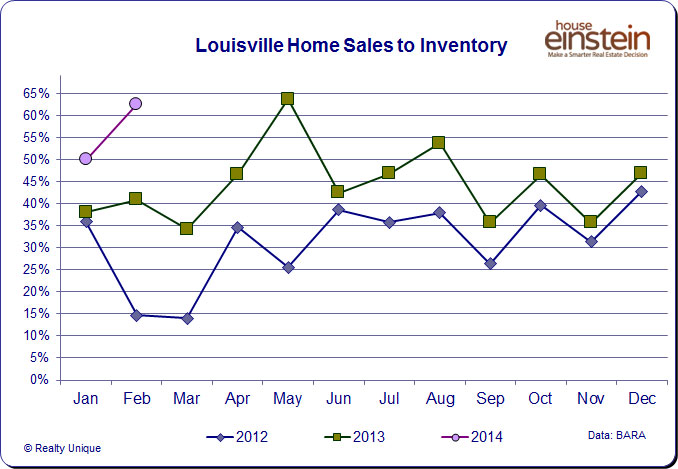
Absorption is the percentage of sales relative to the previous month’s inventory. It’s an indication of liquidity.
Absorption reached 63% last month, the second highest month since I’ve been tracking the data. Current absorption levels are 3x the long term average for February of 20%.
INVENTORY VS. SALES VOLUME
This is my favorite chart of the series. It shows the most recent sales and inventory compared to the long term average. At a quick glance you tell how the market “feels” to participants.
As we begin to enter the busy selling season, inventory is running a shocking 70% below the long term average while sales volume remains slightly elevated.
I hope you’ve enjoyed this analysis. If you’re considering buying or selling real estate in Louisville, or elsewhere in Boulder County, and would like professional advice based on market conditions with a proven track record of client satisfaction, call me. 303.746.6896. I can help you make a smarter real estate decision.
—
Market Conditions in Louisville, CO [Analyze This]
by Osman Parvez
It’s time for an update on real estate market conditions in Louisville, CO. The following analysis is based on data through the end of February, 2014.
To receive my regular research report, subscribe to House Einstein research. Click HERE.
INVENTORY
As with other parts of Boulder County, the big story remains the inventory shortage. Only 20 houses were on the market in Louisville last month, down 47% from the same period a year ago.
SALES VOLUME
10 homes sold during the month of February, 11% more than last year.
In a small market like Louisville, month to month activity can be quite volatile. It’s important to look at longer periods of time to get a sense of the real trend.
90 homes sold during the past six months (ending in February), a 5% increase from the same period a year ago.
Over the last twelve months, 238 homes sold. Up 1% from a year earlier. Note that sales volume remains well below the peak of 2006.
DAYS TO OFFER
The average days to offer fell to 34, the lowest February reading since I’ve been tracking. Keep in mind that desirable properties have been going under contract almost immediately. It’s important to see houses as soon as they’e listed for sale.
MEDIAN PRICE
 |
The median sale price during February was $487,500.
ABSORPTION
Absorption is the percentage of sales relative to the previous month’s inventory. It’s an indication of liquidity.
Absorption reached 63% last month, the second highest month since I’ve been tracking the data. Current absorption levels are 3x the long term average for February of 20%.
INVENTORY VS. SALES VOLUME
This is my favorite chart of the series. It shows the most recent sales and inventory compared to the long term average. At a quick glance you tell how the market “feels” to participants.
As we begin to enter the busy selling season, inventory is running a shocking 70% below the long term average while sales volume remains slightly elevated.
I hope you’ve enjoyed this analysis. If you’re considering buying or selling real estate in Louisville, or elsewhere in Boulder County, and would like professional advice based on market conditions with a proven track record of client satisfaction, call me. 303.746.6896. I can help you make a smarter real estate decision.
—
Share This Listing!
More about the author
Osman Parvez
Owner & Broker at House Einstein as well as primary author of the House Einstein blog with over 1,200 published articles about Boulder real estate. His work has appeared in the Wall Street Journal and Daily Camera.
Osman is the primary author of the House Einstein blog with over 1,200 published articles about Boulder real estate. His work has also appeared in many other blogs about Boulder as well as mainstream newspapers, including the Wall Street Journal and Daily Camera. Learn more about Osman.
Work with
House Einstein
Thinking about buying or selling and want professional advice?
Call us at 303.746.6896
Your referrals are deeply appreciated.


