End of Summer Boulder Market Wrap Up [Analyze This]
by Osman Parvez
Ready for another look at market conditions in Boulder?
Straight to the charts…
This chart shows total inventory for houses (blue) and condos and town Homes (orange). Total inventory (which includes pending, active/backup, and active listings) has been dropping from late June through Labor Day. There are now 25% fewer houses on the market. Condos and town homes have fallen 33%.
If you’re a regular blog reader, you know that this seasonal pattern is normal for Boulder. Inventory grows in January and peaks in June before reaching a bottom in December. What’s not normal is inventory compared to the long term average. We’re still at historic lows.
Take a look.
This chart above shows inventory of attached dwellings in the City of Boulder. The shaded area is the average monthly inventory for a ten year period. The red line is this year. July inventory was 55% below the long term average for the month.
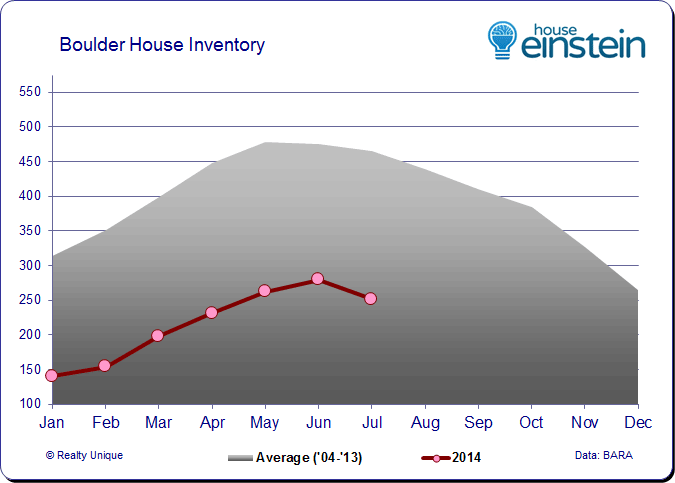
Here’s the same chart for single family houses in Boulder. The shaded area represents the ten year average on a monthly basis. The red line is this year. July saw inventory levels 46% below the long term average.
What Most Boulder Realtors Don’t Know
(But Should)
This chart above shows percentage of properties under contract by property type. From late June to early September, the percentage of single family houses under contract fell substantially, from 44% to 34%. Meanwhile, Condos and Town Homes have risen slightly, from 51% to 53%.
To put it bluntly, this is unusual market activity. Both property types should be dropping but attached dwellings are holding in there.
What Does It Mean?
For buyers and sellers, the market for Condos and Town Homes feels just like summer. The market for single family houses? Not so much.
Right now, there is clearly higher demand for attached dwellings than traditional single family homes in Boulder. Market data also shows that attached dwelling sales are far closer to the historic high volume mark than single family homes (unpublished). We’ll look at those pretty charts in another post, for now you’ll just have to trust me.
Remember: market conditions impact everything, most importantly your search and offer strategy (if you’re buying) and pricing (if you’re selling). How can you expect to negotiate effectively if you’re going in blind?
How It Affects You
I hope you’ve found this analysis useful but to make a smart real estate decision, you need to understand market conditions relative to your price range, location, and property type. There is no shortcut, no amount of happy talk or hand waving that makes up for it.
If your ready to talk about your real estate situation, choose your real estate adviser carefully. Go with an agent who understands market conditions at a high level and will dig through the neighborhood carefully. It’s the only way to give you the very best advice. Don’t forget, that’s what you’re paying for.
If you’d like to consider me for that role, you can learn more about me HERE or go ahead and click HERE to schedule an appointment. You can also call me directly at 303.746.6896.
—
As always, your referrals are deeply appreciated.
Share This Listing!
More about the author
Osman Parvez
Owner & Broker at House Einstein as well as primary author of the House Einstein blog with over 1,200 published articles about Boulder real estate. His work has appeared in the Wall Street Journal and Daily Camera.
Osman is the primary author of the House Einstein blog with over 1,200 published articles about Boulder real estate. His work has also appeared in many other blogs about Boulder as well as mainstream newspapers, including the Wall Street Journal and Daily Camera. Learn more about Osman.
Work with
House Einstein
Thinking about buying or selling and want professional advice?
Call us at 303.746.6896
Your referrals are deeply appreciated.


