Boulder’s Strong Demand and Record Low Inventory [Analyze This]
by Osman Parvez
—-
Writing offers and getting nowhere? You’re not alone. Record low inventory and strong demand is what you’re up against.
No happy talk and hand waving. We advise our clients with the facts about market conditions. It’s the only way to help you make a smarter real estate decision.
Let’s look at the numbers.
Boulder House Inventory
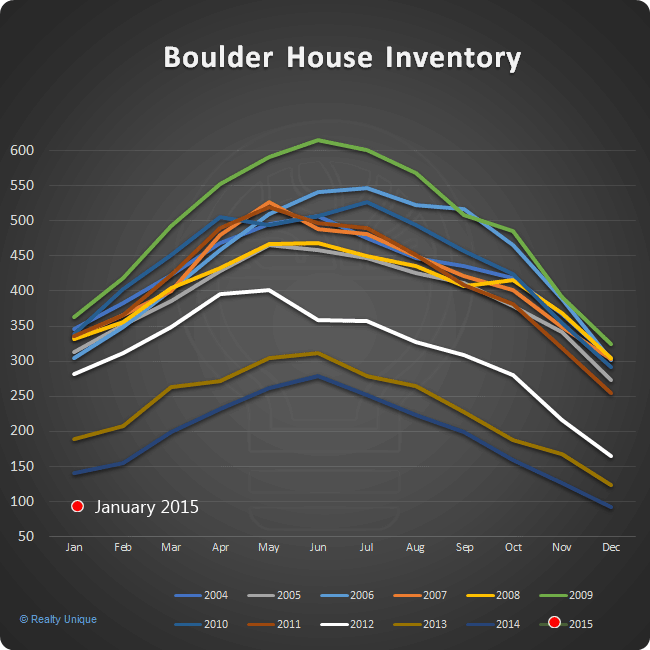
The chart above shows inventory of detached, single family houses in Boulder over the last twelve years. That bright green line on top? That was record high inventory five years ago. The dark blue line at the bottom? Last year.
See that red dot? That’s where inventory is starting out in 2015. It’s the 2nd lowest point in more than a decade. The lowest point was the previous month. Look at 2012, 2013, and 2014’s pattern. Note the trend.
Here’s another (cleaner) view of the same data.
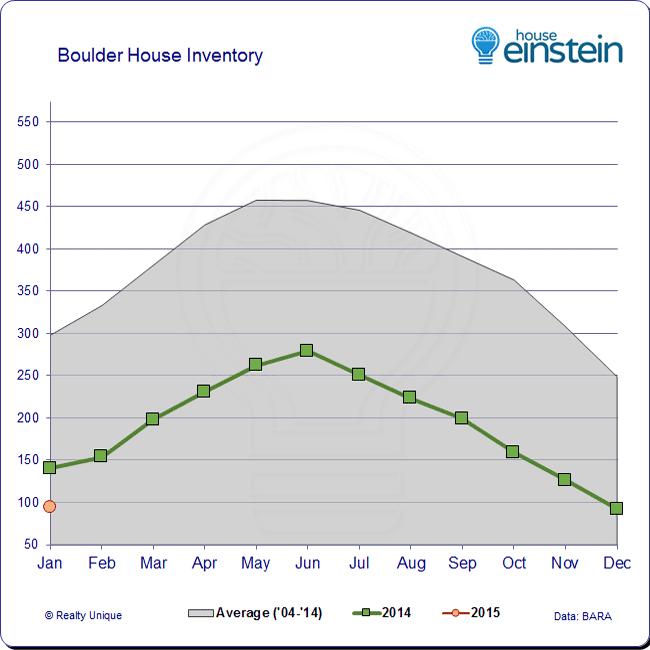
The grey shaded area is the average long term inventory for single family houses, by month. The green line represents last year’s inventory. The pink line is 2015.
Last month there were only 94 homes on the market, compared to a long term average of 298. January’s inventory was a shocking 68.4% below average.
Inventory has started to rise seasonally but it’s still far lower than last year. As of this writing, there are only 116 homes in inventory. That’s 24.6% below what it was last February. 52% of inventory is available, the rest is under contract.
Now, let’s look at the demand side.
Boulder Sales Volume
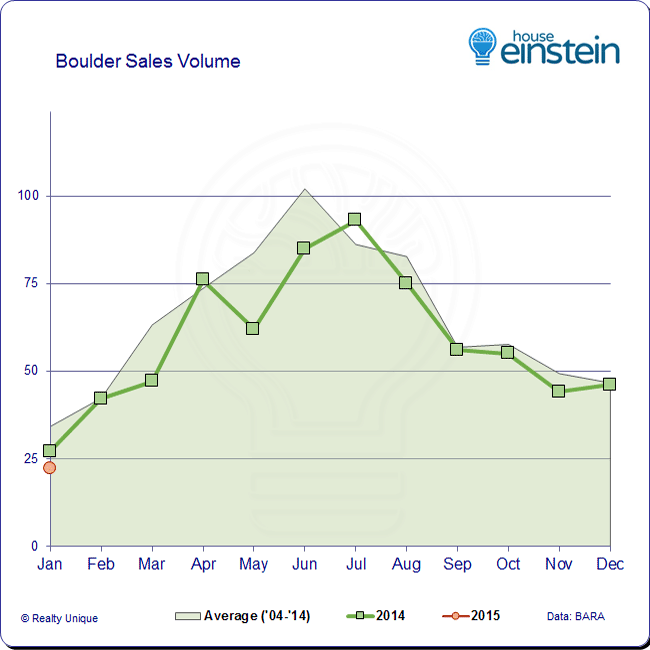
The chart above shows sales volume. The green shaded area is the long term average sales volume, by month. The green line is last year’s sales volume. The little pink dot represents this year.
Sales volume during the whole of 2014 followed the typical seasonal pattern and wasn’t far off the long term average. 708 houses closed, compared to a long term average of 778. That’s a 9% decrease from the long term average. Given the ultra low inventory, we’re surprised sales volume wasn’t much much lower.
Our Advice
-The median sale price for houses in Boulder last year was $685,000. These are not trivial assets. Intelligent real estate decisions are based on a deep understanding of market conditions and professional advice.
-Choose your adviser carefully. We’ve seen recent advertising by listing agents who claim that their professional marketing is the reason for the bidding war, even as they mismanage the negotiation process and leave money on the table. Don’t be fooled. It’s Mr. Market. The best negotiation in a bidding war is a semi-transparent technique HBR calls negotiauction. Call us for details.
-The relevant market analysis for your needs is based on your unique real estate objective. Market conditions vary by price range, property type, and location in Boulder. Whether your goal is maximize the sale price or you’re the purchasing power of your equity, choose your Realtor carefully.
Any questions? Call us – but only if you haven’t signed a buyer agency agreement with our competitors. We’ve recently had several buyers reach out to us who were unhappy with their agents but locked into iron-clad agreements with rookie agents. Read the holdover provision section of the buyer agency agreement carefully before signing. 303.746.6896.
Notes:
- BARA’s historical data doesn’t track pending sales. We do that separately in another analysis. Contact us for details.
- The analysis above is for the City of Boulder, single family houses only. Condos and town homes are not included.
The next Boulder Real Estate Meetup is February 26th. We’ll be discussing market conditions, strategies, and much more. Join us! RSVP and learn more HERE.
—-
Want to get blog updates via email? Click HERE.
Ready to buy or sell? Schedule an appointment or call 303.746.6896.
You can also like our Facebook page or follow us on Twitter.
As always, your referrals are deeply appreciated.
—
The ideas and strategies described in this blog are the opinion of the writer and subject to business, economic, and competitive uncertainties. We strongly recommend conducting rigorous due diligence and obtaining professional advice before buying or selling real estate.
Share This Listing!
More about the author
Osman Parvez
Owner & Broker at House Einstein as well as primary author of the House Einstein blog with over 1,200 published articles about Boulder real estate. His work has appeared in the Wall Street Journal and Daily Camera.
Osman is the primary author of the House Einstein blog with over 1,200 published articles about Boulder real estate. His work has also appeared in many other blogs about Boulder as well as mainstream newspapers, including the Wall Street Journal and Daily Camera. Learn more about Osman.
Work with
House Einstein
Thinking about buying or selling and want professional advice?
Call us at 303.746.6896
Your referrals are deeply appreciated.


