Boulder and the L’s [Inventory Analysis]
by Osman Parvez
—-
Smart house buyers and sellers adjust strategy to market conditions.
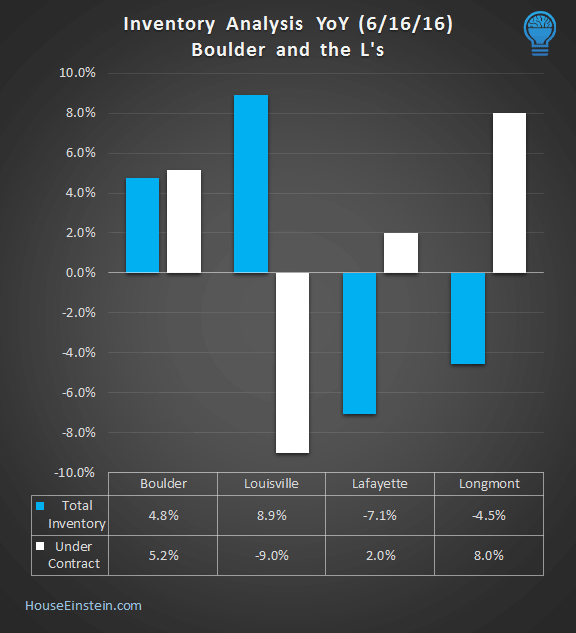
The chart above shows the annual change (year over year) in total house inventory and inventory under contract for Boulder and the L’s (Louisville, Lafayette, and Longmont).
The L’s show the pattern you’d expect – when supply drops, percent under contract (a.k.a. absorption) increases. Louisville inventory is up 8.9% and homes under contract fell 9.0%. Lafayette inventory dropped 7.1% and houses under contract increased by 2.0%. Longmont inventory dropped 4.5% and houses under contract increased 8.0%.
Boulder is the anomaly. Total inventory is up almost 5% while houses under contract have also increased by about the same.
Remember: market conditions vary by price range, property type, condition, and location – down to the neighborhood and street level. Talk to your real estate adviser.
Intelligent real estate decisions are based on a deep understanding of market conditions.
—-
Ready to buy or sell? Schedule an appointment or call 303.746.6896.
You can also like our Facebook page or follow us on Twitter.
As always, your referrals are deeply appreciated.
—
The ideas and strategies described in this blog are the opinion of the writer and subject to business, economic, and competitive uncertainties. We strongly recommend conducting rigorous due diligence and obtaining professional advice before buying or selling real estate.
Share This Listing!
More about the author
Osman Parvez
Owner & Broker at House Einstein as well as primary author of the House Einstein blog with over 1,200 published articles about Boulder real estate. His work has appeared in the Wall Street Journal and Daily Camera.
Osman is the primary author of the House Einstein blog with over 1,200 published articles about Boulder real estate. His work has also appeared in many other blogs about Boulder as well as mainstream newspapers, including the Wall Street Journal and Daily Camera. Learn more about Osman.
Work with
House Einstein
Thinking about buying or selling and want professional advice?
Call us at 303.746.6896
Your referrals are deeply appreciated.


