Strategy by Price Range [Analyze This]
by Osman Parvez
—-
For the last few days, I’ve been writing about inventory conditions in Boulder. It’s time to wrap up the analysis.
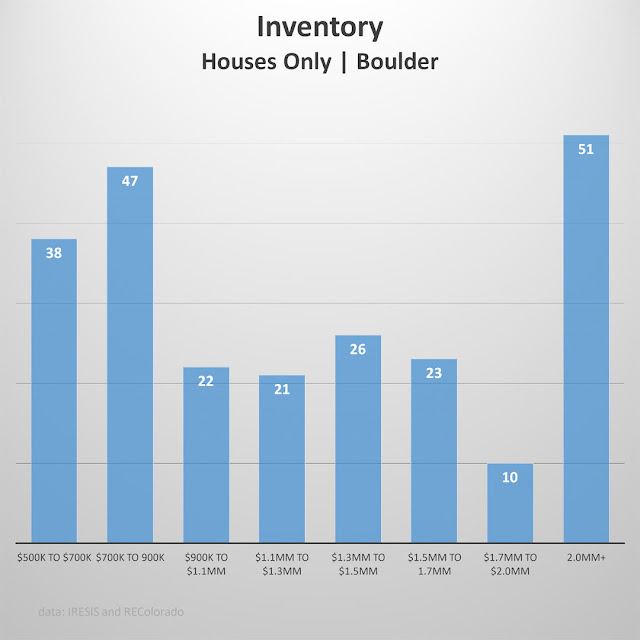
The following chart shows inventory of houses by price range in Boulder. It excludes attached dwellings like condos or town homes, multifamily property, and vacant lots. The source of data is both regional MLS systems, duplicates and other junk have been carefully removed.
There is much more inventory between $500K and $900K, compared with price points between $900K and up to $2.0MM. Once again, it’s a tale of two markets. The $2.0MM+ tranche is open ended, which is why it’s so high.
The chart above becomes more actionable when you compare it to following.
Together, these charts form a starting point for buyer or sellers to understand market conditions.
Sellers: If the home you’re selling is at the low end of the charts above, for example, you have more breathing room to test the market. You’ll still deal with the negative stigma associated with listings that have been on the market for a significant period, but market demand is so intense, it should overcome it. There is both greater demand and depth of market at the lower end. At prices beginning at $900K and moving upward, the market is more thinly traded. Sellers should be much more thorough in analyzing the market and professionally marketing their property. If you want to maximize the selling price, you only have one chance to get it right. Choose your Realtor carefully.
Buying and selling real estate is emotional. If a property has been on the market for several weeks, buyers want to know “what’s wrong with it?” Even if the answer is “nothing, the seller overpriced it,” the magic is gone. The exclusivity factor, that drives sales at all price points, is missing.
Buyers: For certain price points, locations, and property types within the city of Boulder, you can continue to expect bidding wars. The key to success is having confidence that (a) you have an effective strategy for finding homes, (b) you’re bidding on the right house for you and your family, (c) you know the home’s real value, and (d) you’ve negotiated intelligently.
Your realtor’s job is to guide you on property selection, advise and educate you on market conditions, and get you a seat at the bidding table. Once you’re under contract, they should also be supporting complete and thorough due diligence. Again, choose your Realtor carefully.
Additional Resources:
Boulder Inventory Stabilizes, Spring Outlook Positive.
Boulder Entry Level Remains Strong, High End At Risk of Correction
Signs of a Slowing Market
Note: For many years, I’ve published charts sized just under 600 pixels wide at 72 dpi in a GIF format. This results in crisp charts that load quickly, but only on conventional monitors and laptop screens. A client pointed out that on high resolution tablets and smart phones, some of these images are pixelated. Thus, I’m testing chart formats and resolutions. The image above was formatted to favor Instagram. If you have any feedback on the charts, please leave a comment.
—-
Ready to buy or sell? Schedule an appointment or call 303.746.6896.
You can also like our Facebook page or follow us on Twitter.
As always, your referrals are deeply appreciated.
—
The ideas and strategies described in this blog are the opinion of the writer and subject to business, economic, and competitive uncertainties. We strongly recommend conducting rigorous due diligence and obtaining professional advice before buying or selling real estate.
Share This Listing!
More about the author
Osman Parvez
Owner & Broker at House Einstein as well as primary author of the House Einstein blog with over 1,200 published articles about Boulder real estate. His work has appeared in the Wall Street Journal and Daily Camera.
Osman is the primary author of the House Einstein blog with over 1,200 published articles about Boulder real estate. His work has also appeared in many other blogs about Boulder as well as mainstream newspapers, including the Wall Street Journal and Daily Camera. Learn more about Osman.
Work with
House Einstein
Thinking about buying or selling and want professional advice?
Call us at 303.746.6896
Your referrals are deeply appreciated.


