Osman, How Much Should I Offer? [Investment Analysis]
by Osman Parvez
—-
We took one of our buyers to see an investment property at the Wimbledon in Boulder last week. At the end of the showing, they wanted to buy it. They asked “Osman, how much should we offer?”
How much to offer and how much to list are the most common questions we get from our clients. To give you a sense of the type of work we do to answer the question, let me walk you through the analysis. This is far beyond the service you’ll receive from a typical Realtor.
We believe that making an offer or listing your property without a deep understanding of historical market performance, negotiations, and comparable sales is shooting blind. Smart real estate decisions are based on deep market knowledge.
If you’re buying or selling, call us. 303.746.6896.
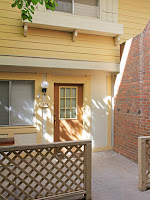
Here’s the condo: 3161 Madison Ave N-106.
Background
Wimbledon units rent very easily. They’re walking distance to the CU campus and the amenities suit the student lifestyle. Construction quality is OK, although these units are known to contain asbestos. Some units have underground parking. Over the years, I’ve seen some CU parents express security concerns for the units with sliding glass door access directly to the grassy, park-like areas. A block further west, you’ll find Landmark Lofts and the Provence – ritzy, new condos charging far higher rent.
Historical Negotiations at Wimbledon
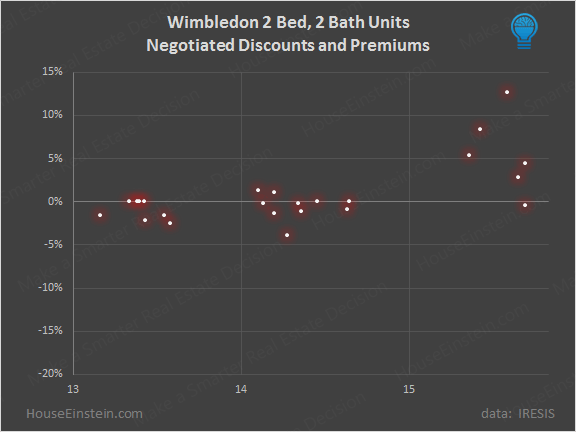
Like most Boulder real estate, properties have historically traded at a discount to asking price. This chart shows the negotiated discount or premium paid for comparable 2 bedroom, 2 bath units dating back to 1997. 1999 and 2000 was the last time substantial numbers of units sold at asking or for a premium. During the last year, nearly all units did so at premiums approaching 15%.
This next chart is a narrower focus on just the last few years. During 2014, a couple of units traded at premiums to asking while most sold for asking price or at a small discount. In 2015, the majority obtained a premium to asking.
Historical Market Performance at Wimbledon
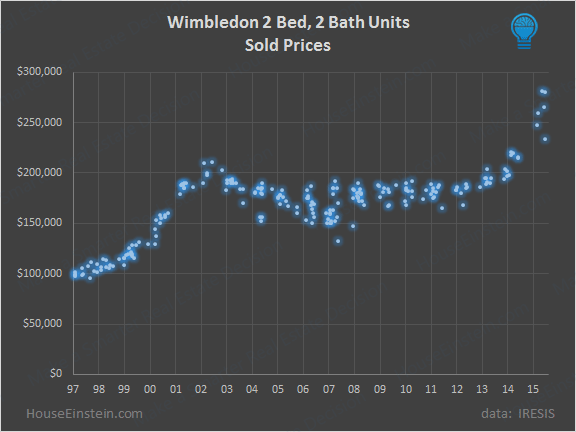
This chart shows sold prices for 2 bed, 2 bath units dating back to 1997. You can see the run-up in prices corresponding to the dot-com bubble. Prices dropped from 2002 to 2005, and then more or less skidded sideways until about 2013.
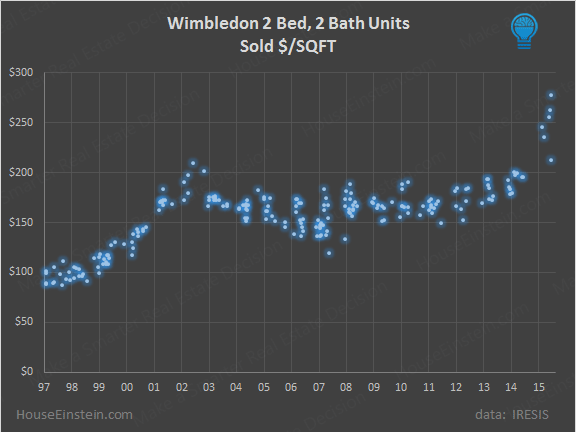
Here’s the same chart on a $/SQFT basis. You can see how quickly prices have jumped this year. You can also clearly see the bubbly activity, most notably in 2002.
Comparable Analysis for 2 Bed, 2 Bath Units at Wimbledon in Boulder
Let’s look at the specific units that sold this year. Click HERE for pics and more information. You’ll need that link to compare finish quality. Analysis below.
3009 Madison Ave I-108 sold for $234K, $1K less than asking. This unit backed to 30th and had a designated garage parking space. Despite the nosier location, in my opinion this one sold for well under market value. It was entered into the MLS only after it was under contract. I’ve often warned about the risk of private sales costing sellers money. Without knowing what the market will bear, you risk leaving money on the table. This one proves the point. Check out the lofty sale prices driven by bidding wars, for the rest of the comps.
3460 Colorado Ave B-12. Sold for $247,500, $12,000 more than asking to a cash buyer. Lease in place. Does not back to 30th. No garage.
3161 Madison Ave R-112. Sold for $260K, or 20K more than asking. 1 space in the garage. Cash buyer.
3000 Colorado Ave 131H. Sold for $261K, or $21K more than asking. 1 parking space in the garage. Conventional mortgage with more than 20% down. By the way, the seller on this one is a Realtor based in Denver. He used the Denver MLS, consequently the data point is not on the charts above. The sale price represents 9.2% more than asking if you want to add it.
3480 Colorado D-7. Sold for $265K, $7K more than asking. No garage space. Cash buyer.
3460 Colorado B-13. Sold for $280K or $22K more than asking. No garage space. Cash buyer.
3293 Madison S-101. Sold for $281,500, or $31K more than asking. This unit was listed as having “2 car off street” parking spaces, possibly one in the garage and one reserved. Buyer used a conventional mortgage and only put down 10%.
3161 Madison N-106. The target unit. Last sold for $190,000 in 2003. Rented at $1550 with next year’s rent forecasted to be $1600 to $1700. Asbestos containing popcorn ceilings “professionally” removed, to be verified during due diligence.
The Investment Property Model
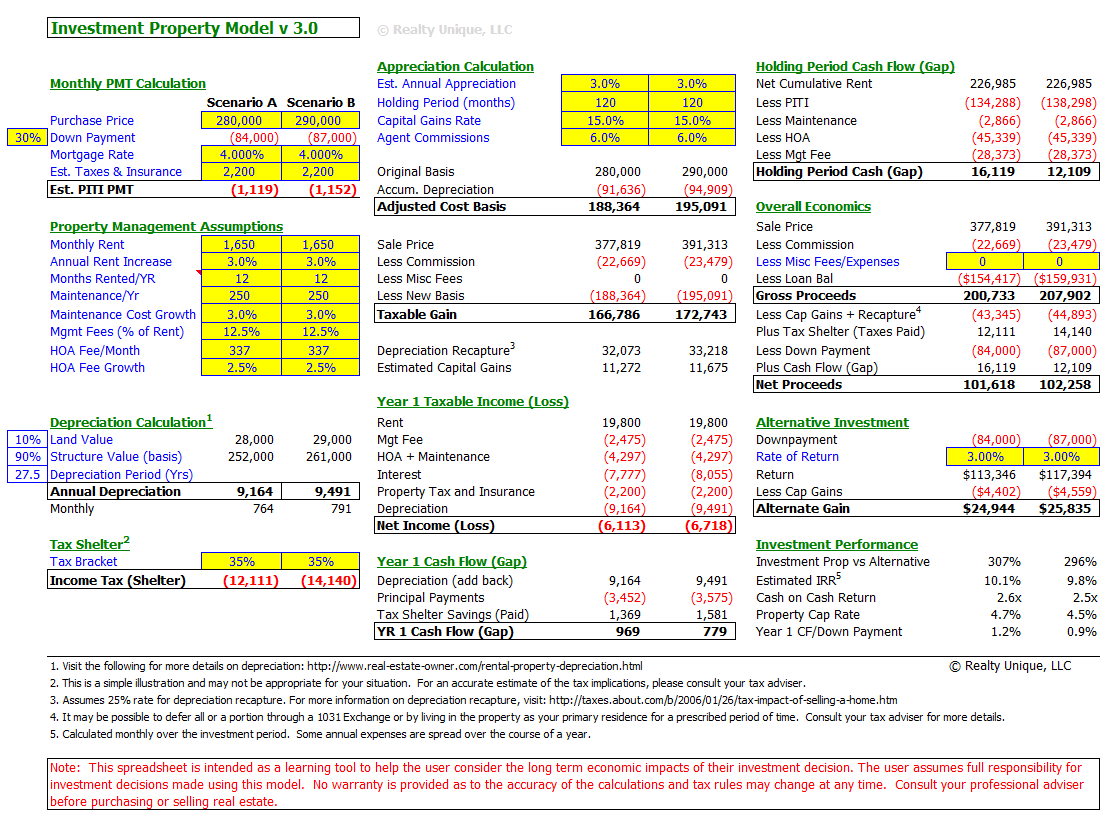
One approach to valuation is to model investment returns over time. Here’s how my proprietary investment property model breaks down assuming $280,000 (scenario A) and $290,000 (scenario B) purchase prices with relatively conservative assumptions, including a cash-out refi after closing.
Here’s a screenshot of the actual model:
We could spend a huge amount of time talking about the model. It has 20+ variables and we use it routinely to analyze and discuss investments with our clients. Let’s cut to the chase. Over a ten year holding period, with the assumptions highlighted in yellow above, the the difference between $290,000 and $280,000 is that the Internal Rate of Return (IRR) drops from 10.1% to 9.8% and the cash on cash return drops from 2.6x to 2.5x.
As a real estate investor myself, a 10% levered IRR at 4% forecast annual appreciation is not particularly impressive. At 5.5%, it only jumps to 14% but it’s surprisingly resilient at the low end of the appreciation scale. See the chart below.
Although the IRR is not that exciting, the flip side to that is understanding that the returns come with far less risk than investing in more marginal locations. In other words, the units rent easily because the development is so close to CU Boulder. You may have your pick of tenants and when rents rise, they should rise faster at this location.
As with all investments, there is an inverse relationship between risk and return.
How Much to Offer?
Negotiation always begins with a phone call. Experienced agents give out guidance on competing offers, submission deadlines, the ideal closing date for the seller, and response deadlines. Some listing agents aggressively shop offers, others feel this isn’t a fair playing field. Timing for offer submission, relative to the deadline can therefore be critical. In some cases it’s smart to be the first offer at the table. In others, you want to be the last offer received in order to blow out the competition. As I’ve griped about before, some listing agents are religiously opposed to escalation clauses. They want “highest and best” only, even if it leaves money on the table or forces out some potential bidders.
In my pre-offer discussions with this particular listing agent, I learned that to be competitive, my buyer’s all cash offer would need to come in at the upper 280’s. We were also advised to waive inspection and appraisal, and that escalation clauses would absolutely not be considered. There’s much to be said for the risks involved with waiving buyer protections, but I’ll save that for another post. It’s sufficient at this point to simply say my buyer was comfortable with the risk.
The analysis showed not much of a difference between $280,000 and $290,000. For a 10 year holding period, it hardly mattered. What really mattered to my buyer was the risk that monthly rent growth flattens out in the near future. The model showed a 1% difference in rent growth can amount to $7,000 or more of lost net proceeds.
As with all deals, our job is to advise on and execute strategy. Our clients make the decisions.
In this case, my client decided that their top number for the property was slightly below the recommended submission price of “upper 280’s.” This was based more on their personal comfort level than the investment analysis. In the end, the client decided to walk away from the negotiation table and we cut our losses. The answer to the question? Offer nothing.
Conclusions
I hope you’ve found this analysis helpful. The model itself is just one of our analytical tools in the advisory work we do for our real estate buyers and sellers. It’s available to all of our clients, primary home buyers or investors, but due to its complexity, we offer it only on a direct one-on-one consultation basis.
From our perspective, you can make a smarter real estate decision based on a solid, carefully researched analysis and the professional experience of your Realtor, or you can roll the dice and take a gamble. Choose carefully.
Sing it Kenny.
—-
Ready to buy or sell? Schedule an appointment or call 303.746.6896.
You can also like our Facebook page or follow us on Twitter.
As always, your referrals are deeply appreciated.
—
The ideas and strategies described in this blog are the opinion of the writer and subject to business, economic, and competitive uncertainties. We strongly recommend conducting rigorous due diligence and obtaining professional advice before buying or selling real estate.
Share This Listing!
More about the author
Osman Parvez
Owner & Broker at House Einstein as well as primary author of the House Einstein blog with over 1,200 published articles about Boulder real estate. His work has appeared in the Wall Street Journal and Daily Camera.
Osman is the primary author of the House Einstein blog with over 1,200 published articles about Boulder real estate. His work has also appeared in many other blogs about Boulder as well as mainstream newspapers, including the Wall Street Journal and Daily Camera. Learn more about Osman.
Work with
House Einstein
Thinking about buying or selling and want professional advice?
Call us at 303.746.6896
Your referrals are deeply appreciated.


